
Whether you’re planning your next big marketing campaign or trying to fix that sales funnel that’s leaking on both ends, concept maps are your go-to solution. These simple visual tools help you untangle messy ideas and spot patterns, turning chaos into clarity.
A 2024 meta-analysis found that concept mapping significantly enhances learning outcomes, with an overall effect size of 0.776, which indicates a moderate to strong impact.
In this article, we’ll break down real-world examples of concept maps designed for marketing, sales, and customer service. You’ll see how they help map out content plans, manage lead nurturing, and make customer support networks work for, and not against you.
What is a concept map?
A concept map is a visual tool used to organize and represent knowledge. It displays relationships between ideas, concepts, or pieces of information in a structured, hierarchical format. Concepts are written in circles or boxes and connected by lines or arrows labeled with linking words to show relationships.
The purpose of a concept map is to organize complex ideas, making them easier to understand and retain. It helps with brainstorming, problem-solving, and strategic planning by visually mapping connections and uncovering gaps.
Benefits of using concept maps
Whether you’re brainstorming, studying, or planning a project, these maps provide a clear structure that makes complex information easier to grasp. Here are some key benefits of using concept maps:
- They boost memory retention and understanding
Concept maps help you organize thoughts in a way that’s easier to remember. Seeing how ideas connect can make even complicated topics feel simpler. Let’s take students, for example. They use them to link historical events with their causes and effects, improving retention and comprehension.
- They encourage critical thinking and creativity
They’re also great for getting creative and thinking outside the box. Mapping out relationships between concepts helps uncover patterns or ideas you might have missed. Marketing teams sketch out concept maps to link audience needs, messaging angles, and content formats for a new campaign.
- They help with collaborative learning and teamwork
Concept maps make group work easier by giving everyone a shared visual guide. They simplify communication and help teams brainstorm and plan more effectively. Product development teams, for instance, use shared maps to track features, deadlines, and dependencies for a project launch.
- They break down problems into solvable chunks
Big problems feel less overwhelming when you can break them into smaller parts. Concept maps make it easier to spot gaps, see connections, and come up with solutions. Customer service teams map out common issues and their causes to find faster ways to resolve them.
Types of concept maps
Concept maps come in different formats, each suited for organizing and visualizing ideas in unique ways. Here are some of the most common types:
Spider map
A spider map, also known as a cluster map, organizes information around a central idea. The main topic is placed in the center, with related subtopics branching out like a spider’s legs. This structure is ideal for visualizing how smaller ideas connect to a bigger concept.
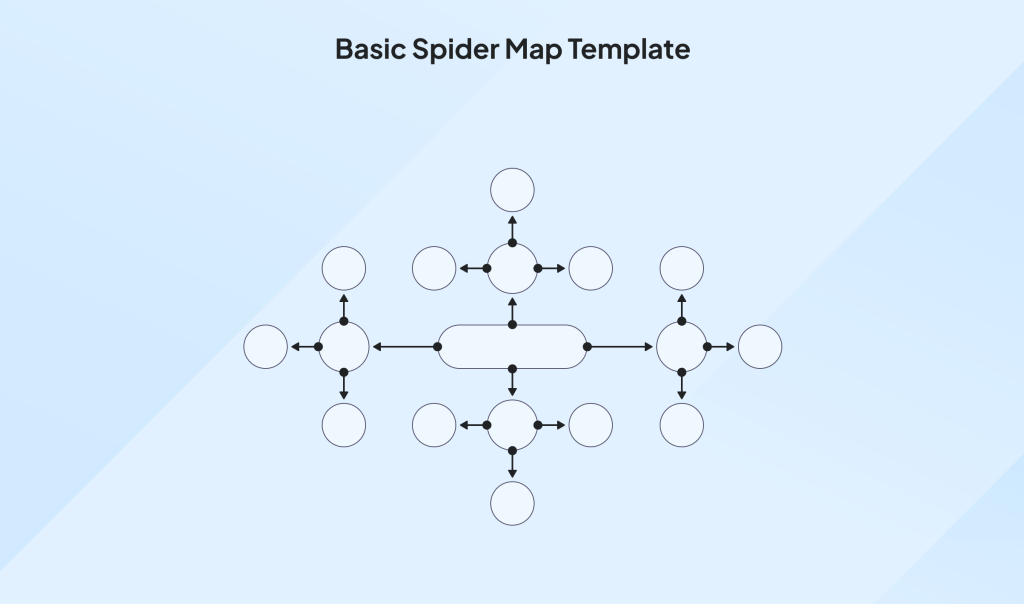
How to use a spider map
Start with your main idea in the center. Add branches for key categories or themes, then expand further by adding details or examples. For example, if you’re planning a marketing campaign, write ‘Marketing Strategy‘ in the center. Add branches for categories like ‘Target Audience,’ ‘Channels,’ and ‘Content Types.’ Then expand further by adding details, such as ‘social media’ under Channels or ‘blog posts‘ under Content Types.
When to use a spider map
Use a spider map when you need to break down broad topics into smaller, related pieces. It’s perfect for brainstorming new ideas, organizing information before writing an article or report, or mapping out customer needs and product features during planning sessions.
Flowchart map
A flowchart map is a visual representation of a process or sequence of steps. It uses boxes or shapes to represent steps and arrows to indicate the flow or direction. This structure is perfect for illustrating workflows, processes, or decision-making paths.
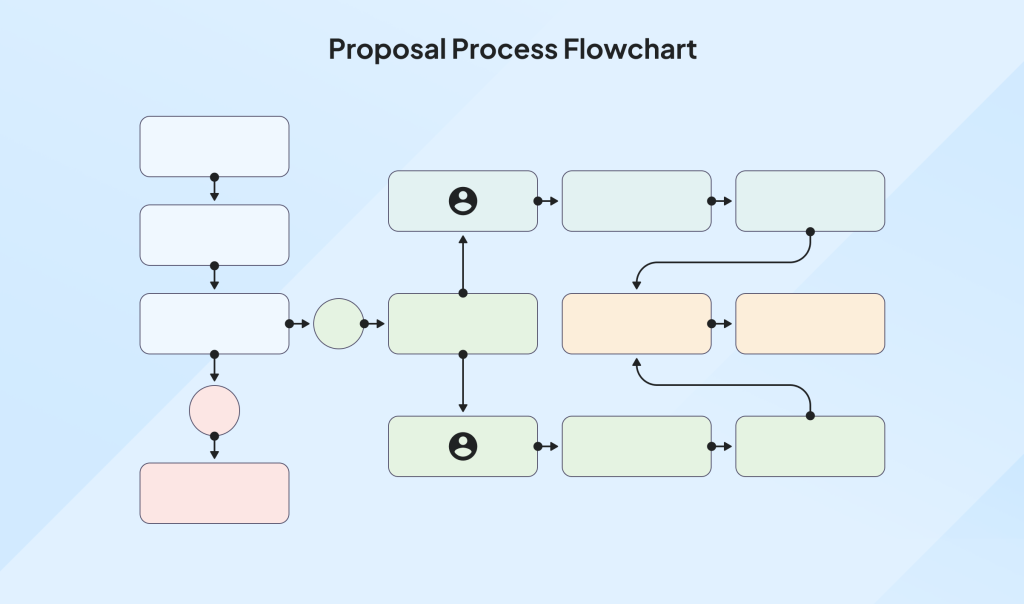
How to use a flowchart map
Begin with the starting point or question at the top or left. Add steps or decisions as boxes, connecting them with arrows to show the flow. If you’re mapping a sales funnel, start with ‘Lead Generation,’ followed by steps like ‘Contact Outreach,’ ‘Follow-Up,’ and ‘Close Deal.’ Use decision points (e.g., ‘Interested?’) to branch off into different actions. It’s a great way to break down processes clearly and logically.
When to use a flowchart map
It’s great for outlining processes, workflows, or decision trees. It’s especially helpful for mapping customer journeys, visualizing project workflows, or defining step-by-step procedures for training and operations.
Hierarchical map
A hierarchical map is a type of concept map that organizes information in a top-down structure. It visually represents relationships and levels of importance between concepts, starting with the most general idea at the top and progressively breaking it down into more specific subtopics below.
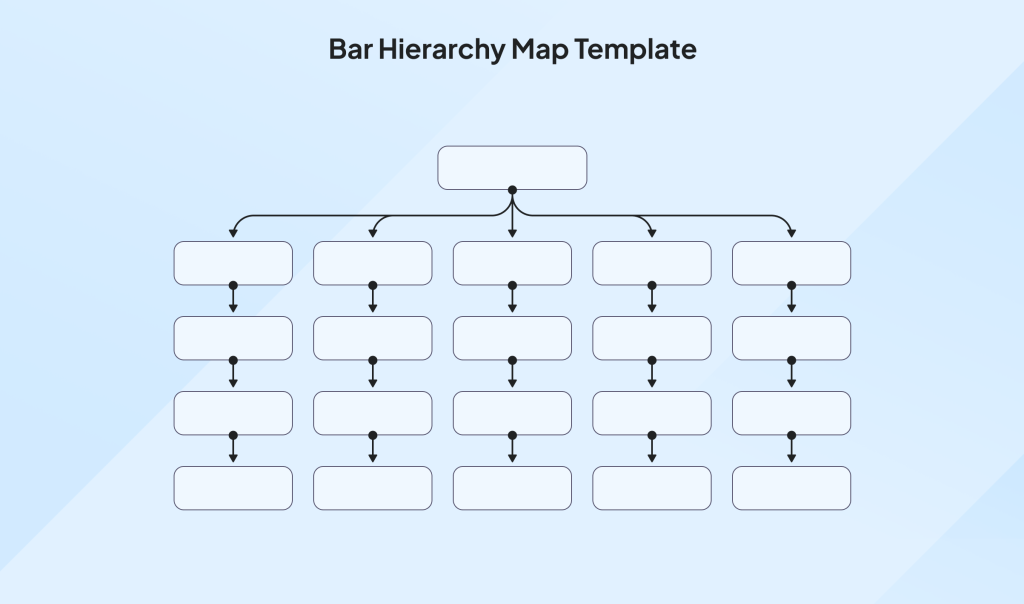
How to use a hierarchical map
Start with your main idea or question at the top or left of the map—this is the starting point of your story. Add categories or subtopics as boxes connected by arrows or lines, showing how each piece fits into the bigger picture. Keep branching out to add specific examples or steps.
Let’s say you’re planning a road trip. Begin with “Road Trip Plan” at the top, then branch into categories like “Destinations,” “Budget,” “Packing List,” and “Activities.” Under “Destinations,” you could list places to visit, and under “Packing List,” you might include items like clothes, snacks, and camping gear. Use decision points like “Route A or Route B?” to map out alternate paths. This method keeps everything organized, easy to follow, and flexible for adjustments.
When to use a hierarchical map
Hierarchical maps are great for outlining processes, workflows, or decision trees. They’re especially helpful for visualizing project plans, mapping team structures, or defining step-by-step procedures for training and operations.
System map
A system map is a visual tool used to represent the components, connections, and interactions within a system. Unlike hierarchical maps, which focus on top-down organization, system maps emphasize interconnectedness and circular relationships. Nodes represent elements or components and lines or arrows show relationships and the flows between them.
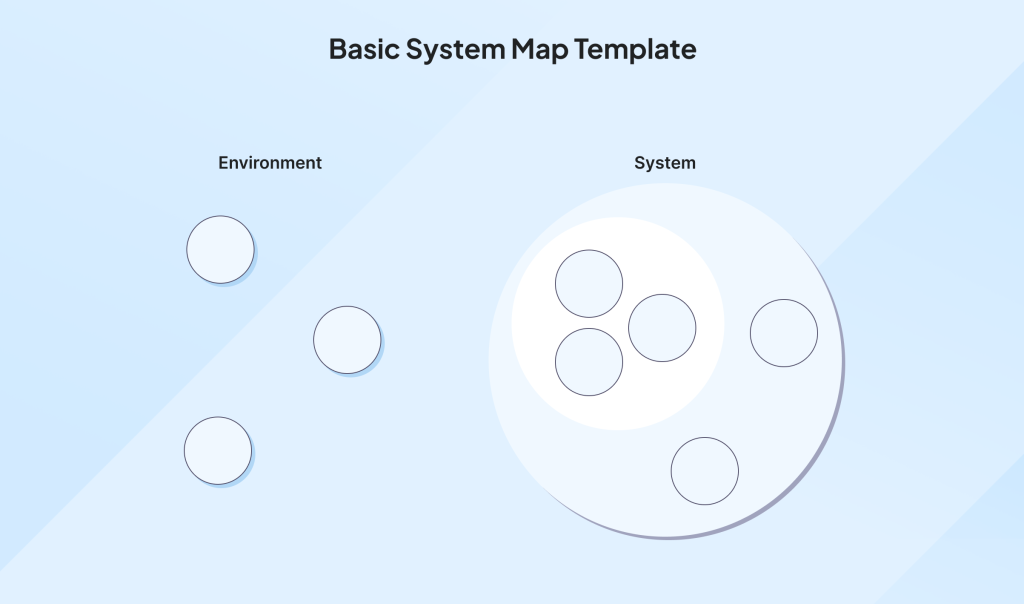
How to use a system map
Start by identifying the main system or process you want to analyze. Place the core component or idea in the center of the map, and add related elements as surrounding nodes. Use arrows or lines to connect these nodes, showing the flow of resources, information, or actions.
For example, when mapping a customer service process, you could place “Customer Inquiry” at the center, with nodes for “Support Team,” “Ticketing System“, and “Knowledge Base” connected around it. Arrows could show how inquiries flow through these elements, highlighting key interactions and dependencies. Decision points, like “Issue Resolved?”, can lead to different paths, such as escalation or follow-up.
When to use a system map
This type of map is particularly useful for identifying bottlenecks, dependencies, and opportunities for optimization. Use system maps to map out processes like supply chains, IT infrastructure, or team communication flows. They’re also helpful for designing new systems or improving existing ones.
How to create concept maps
Creating a concept map shouldn’t feel like a daunting task. It’s just like untangling the threads of your thoughts and ideas.
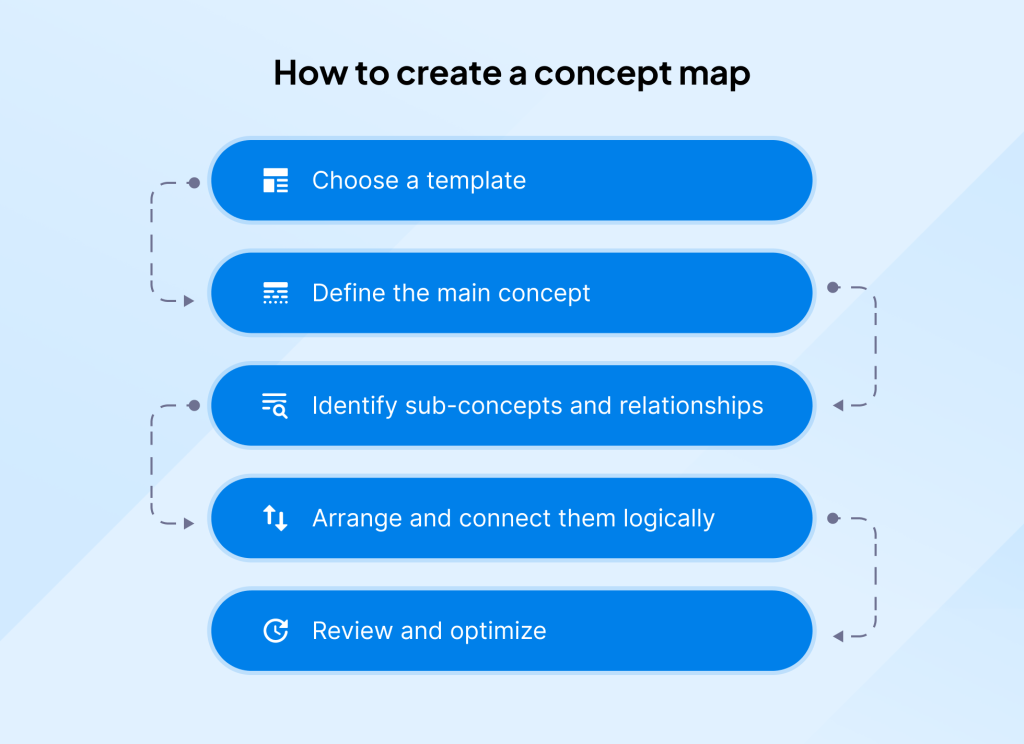
- First, pick a starting point. This could be a blank page or a handy template (templates are a lifesaver if you’re short on time or inspiration).
- Then, zero in on your main concept. What’s the big idea you’re working with? This is the centerpiece of your puzzle—everything else will connect to it.
- From here, let your ideas branch out. Start jotting down related sub-concepts and see how they relate to one another.
- Once you’ve got all your pieces, start arranging them in a way that makes sense to you. Draw connections with arrows or lines, and don’t forget to label those connections. This is where your map starts to make sense.
- Finally, take a step back. Does your map tell a clear story? If it feels cluttered, simplify it. If it feels empty, add more. Remember, concept maps are supposed to help, not overwhelm.
Our one and only golden tip: use color! Highlight key areas with color codes – it makes your map pop and helps you (as much as anyone else) follow it with ease.
Using the right tool makes the difference between “meh” and “wow” when it comes to concept maps. Tools like Lucidchart, Canva, MindMeister, Coggle, and Miro offer a range of features to fit different needs, whether you’re looking for seamless integrations, creative design elements, brainstorming capabilities, simplicity, or team collaboration.
Tips for effective concept maps
Creating a concept map is more than just connecting ideas; it’s about making information clear, structured, and easy to follow. Here are some key tips you should keep in mind:
- Use concise labels for clarity
Keep labels short and to the point to avoid clutter and make your map easy to read. Focus on keywords or short phrases rather than extensive explanations. For example, instead of writing “Key Marketing Channels for Social Media Advertising”, stick to “Marketing Channels”.
- Incorporate colors, shapes, and icons for visual appeal
Use colors to group related ideas, shapes to differentiate types of information, and icons to highlight key points. Color-code categories in a marketing strategy map or use arrows and checkmarks to emphasize progress or decisions.
- Regularly update maps to reflect changes or new insights
Concept maps should evolve as your ideas or projects develop. Schedule periodic reviews to add new information, refine connections, or remove outdated elements. This keeps your map relevant and aligned with your business goals.
Concept maps examples
Concept maps can be applied in various fields to simplify complex ideas, improve learning, and enhance strategic planning. Below are some practical examples:
Marketing strategy
To see how a concept map works in action, let’s take an example from marketing. Imagine you’re planning a campaign for an upcoming product launch. You need to define your audience, choose the right communication channels, and set campaign goals. A concept map can visually organize these elements and show their interconnections.
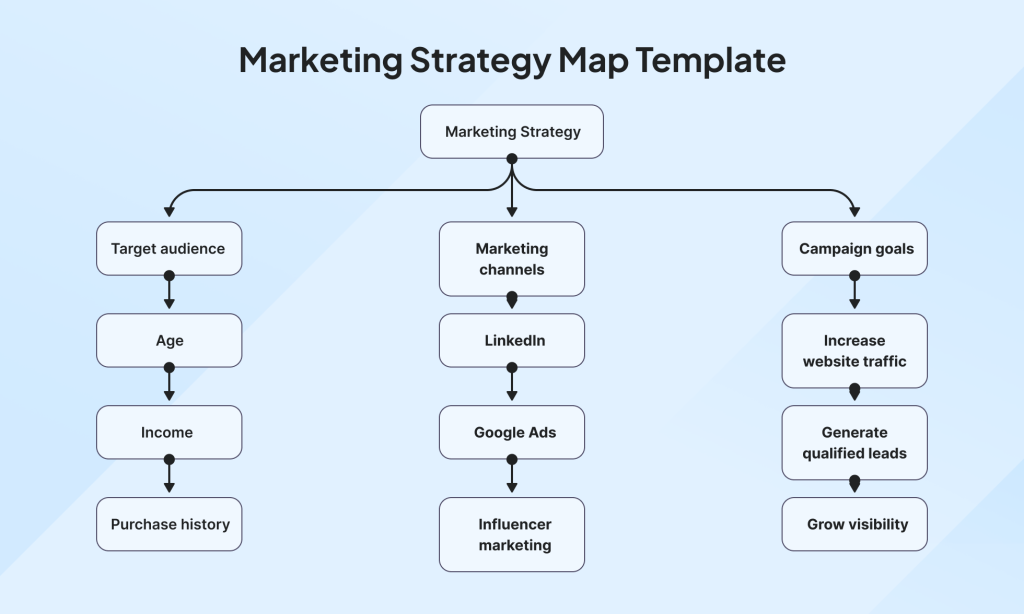
In this example, the central concept is “Marketing strategy.” From here, you can break it into primary branches, such as “Target audience”, “Marketing channels”, and “Campaign goals”. These branches can then be further divided into subtopics:
- Target audience: Includes defining demographics, analyzing customer behavior, and building buyer personas.
- Marketing channels: Covers social media platforms (e.g., Instagram, LinkedIn), email campaigns, and paid ads like Google Ads.
- Campaign goals: Focuses on objectives such as brand awareness, lead generation, or customer retention.
By linking these branches with lines or arrows, you can illustrate how they interact. For instance, your marketing channels need to align with your target audience to ensure the right message reaches the right people.
Sales funnel
Think of a sales funnel as a step-by-step journey that guides potential customers from initial awareness to final purchase. A concept map can outline each phase, showing how prospects move closer to becoming paying customers.
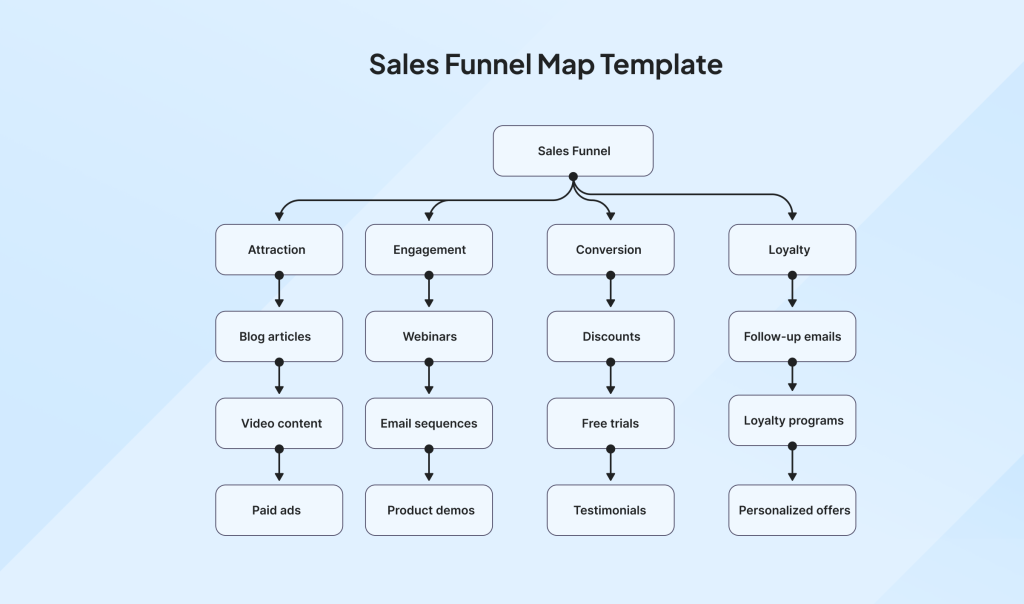
The central idea here is “Sales Funnel.” It is divided into four primary phases: “Attraction,” “Engagement,” “Conversion,” and “Loyalty.” Each phase has specific tactics:
- Attraction: Focuses on grabbing attention through strategies like blog posts, video content, and paid ads. These efforts create visibility and draw people in.
- Engagement: Builds interest by educating and interacting with prospects. Examples include webinars, email sequences, and product demos.
- Conversion: Encourages prospects to make a decision. Discounts, free trials, and testimonials can help nudge them toward purchase.
- Loyalty: Retains customers with follow-ups, loyalty programs, and personalized offers. Happy customers can also become advocates for your brand.
The arrows connecting these stages highlight how strategies work together. For instance, informative content in the Attraction phase can guide prospects into Engagement, eventually leading to Conversion and long-term Loyalty.
Customer support workflow
Handling customer support effectively requires a structured process. A concept map can highlight each stage, ensuring no steps are missed, and inquiries are handled smoothly.
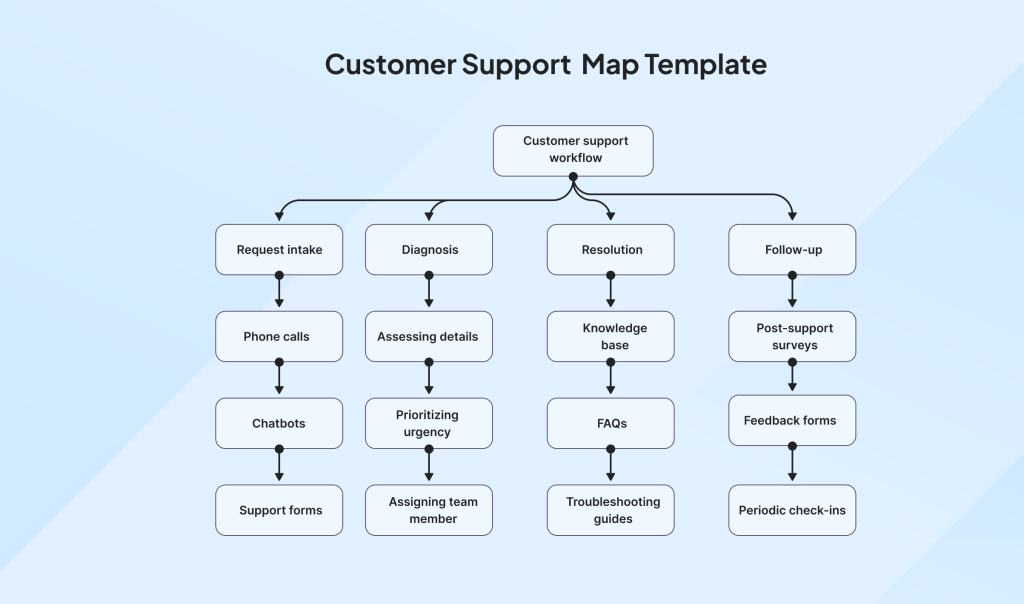
In this case, the central concept is “Customer Support Workflow.” It splits into four main components: “Request Intake,” “Diagnosis,” “Resolution,” and “Follow-up“. These components break down as follows:
- Request intake: Deals with capturing incoming queries through emails, phone calls, chatbots, or support forms. Clear logging and ticketing systems ensure no request is overlooked.
- Diagnosis: Involves identifying the issue by assessing details, prioritizing urgency, and assigning the right team member to handle it.
- Resolution: Focuses on resolving problems quickly and effectively, using tools like knowledge bases, FAQs, or step-by-step troubleshooting guides. Escalation procedures handle more complex issues.
- Follow-up: Ensures the customer is satisfied and identifies areas for improvement. This includes post-support surveys, feedback requests, and periodic check-ins.
Visualizing these steps helps teams spot bottlenecks and improve workflows. Efficient request intake, for instance, speeds up diagnosis, enabling faster resolutions and higher satisfaction rates.
Conclusion
Concept maps are perfect for small and medium-sized businesses as they provide the flexibility and insights needed to stay competitive and organized.
Ready to take the next step? Start experimenting with different types of concept maps and see how they can transform the way you plan, strategize, and execute your ideas. Download our free concept map templates and unlock your team’s hidden marketing potential today!
Related articles

15 Email survey templates to ensure customer feedback
Email surveys have emerged as a critical tool for bu...

SMS spoofing explained and how to avoid being a victim
Concepts such as SMS spoofing, smishing, and phishin...

14 Customer onboarding metrics you should track in 2025
Successful customer onboarding is the foundation of ...

71 Customer satisfaction survey questions by user journey
Gathering customer feedback is crucial for improving...

Top 12 must-know customer service trends for 2025
Customer service plays a key role in business succes...