
Customer engagement metrics assess the emotional connection between a business and its clients. The stronger the connection, the more likely they are to make repeat purchases and recommend the brand to others.
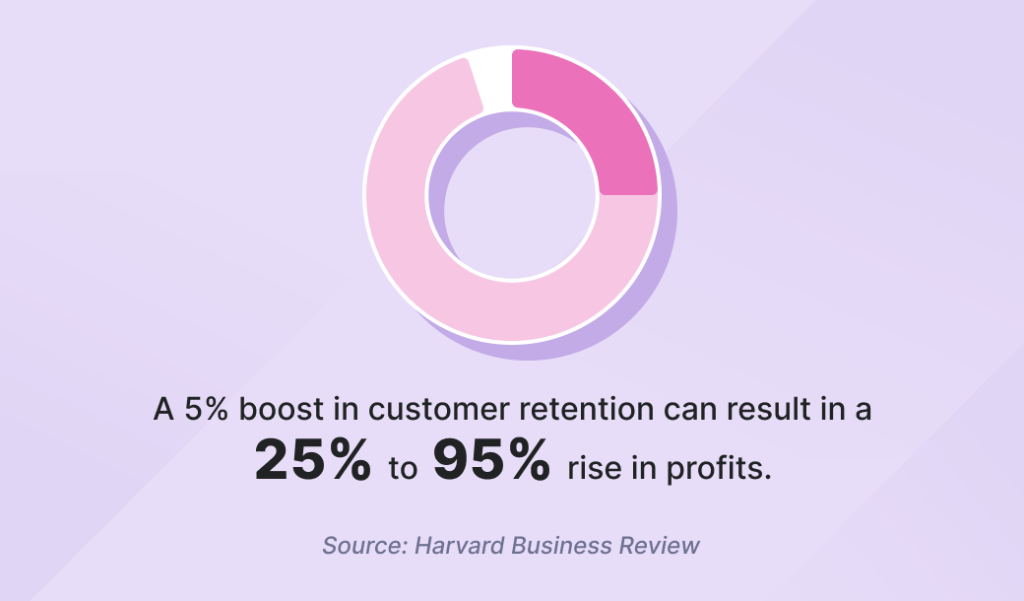
Metrics like customer retention rates, social media interactions, and customer feedback help businesses make informed strategic decisions and optimize customer interactions. A 5% increase in customer retention can lead to a 25% to 95% increase in profits. This is the real impact customer engagement metrics have on a business’s bottom line.
Happy clients determine business success, so it’s no wonder that tracking these metrics has become paramount. This article will teach you how to correctly assess and interpret relevant customer engagement metrics to ultimately achieve the accelerated business growth you’re aiming for.
What are engagement metrics?
Customer engagement metrics are measures used to assess how customers interact with a brand across different touchpoints. This includes websites, social media platforms, email campaigns, and physical locations.
Because they provide a comprehensive view of how customers interact with the brand at different stages of the customer journey, customer engagement metrics help identify what drives customers to engage, what content or products resonate with them, and what inhibits engagement.
Customer engagement metrics help diagnose the health of customer relationships and highlight areas that need strategic adjustments. For instance, by tracking where engagement drops off, whether it’s on a particular web page, during checkout, or within a contact channel, businesses can identify friction points and make improvements.
If you want to really understand customer engagement, you need to go beyond vanity metrics such as likes, follows, and page views. Although they’re easy to understand and look impressive at first glance, they may not reflect true engagement. They often lack context and provide no sentiment analysis insights.
For more accurate information, look for deeper engagement data like:
- Session duration
- Conversion rates
- Click-through rates
- Customer journey paths
Customer engagement metrics are not one-size-fits-all. They differ across industries, product types, and customer bases. Broadly, however, these metrics fall into four main categories:
- User engagement metrics (interaction frequency)
- Product engagement metrics (feature usage)
- Website engagement metrics (traffic and behavior)
- Community engagement metrics (social interaction and feedback)
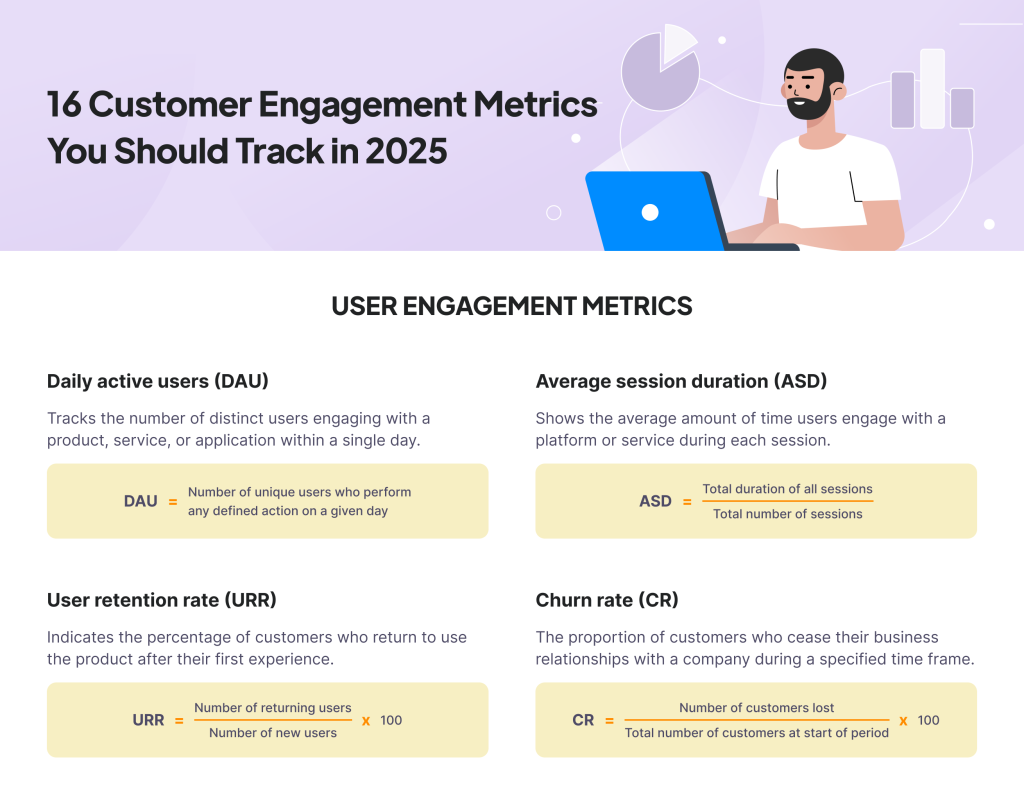
Infographic: Top 16 customer engagement metrics

📥 Feel free to download and share this infographic from this Figma link.
User engagement metrics
User engagement metrics measure how actively and consistently customers are interacting with your product or service. They help gauge whether your audience finds value in what you offer and how involved they are in your platform.
These metrics can reveal key insights into user satisfaction, retention, and overall experience. By tracking user engagement, you can identify patterns that lead to deeper relationships with your product, such as the features users engage with most. This, in turn, helps optimize your product offerings and foster long-term loyalty.
Let’s dive into the most essential user engagement metrics to track.
1. Daily active users (DAU)
DAU measures the number of unique users interacting with a product, service, or app on a given day. It is mostly used by digital platforms, such as social media sites, mobile apps, and software-as-a-service (SaaS) businesses, to assess daily usage and monitor user behavior trends over time.
Why is DAU important?
This metric governs apps or platforms designed for frequent use because it indicates how many users find ongoing value in the product. A high DAU suggests that users have integrated the product into their daily routines, reflecting its relevance and stickiness.
How to calculate DAU
Track the count of unique users engaging with your product, service, or application within a single day.

Example: Let’s say a gaming app wants to calculate its DAU for September 15th. On that day, 1,000 users logged in and played at least one game. Additionally, 200 other unique users only opened the app to check their rewards but did not play. The business decides that both types of interaction qualify a user as “active.” DAU is then 1,000 + 200 = 1200.
Benchmark
A “good” DAU varies widely depending on the product type and industry. A lower DAU can still be healthy for productivity tools or SaaS apps. Business-to-business platforms may see strong performance with 10-15% DAU if the product is designed for weekly rather than daily use.
2. Average session duration (ASD)
This key metric indicates how long users spend interacting with your platform or service on average during a session. It is particularly relevant for websites, apps, and digital products where sustained user interaction is critical to success.
Why is ASD important?
ASD helps you understand the quality of user engagement. A longer session duration suggests that users find your platform engaging, which can lead to increased conversion rates, higher customer satisfaction, and a lower churn rate. It also provides insights into whether your platform effectively meets user needs or requires improvements.
How to calculate ASD
Divide the total duration of all user sessions by the total number of these sessions for a given period.

Example: Suppose over a one-month period, users spent a combined total of 5,000 minutes on your website, and the number of sessions was 2,500. The ASD is 5,000 minutes / 2,500 sessions, indicating that, on average, users spent 2 minutes per session.
Benchmark
For content-heavy websites (e.g., blogs or news sites), an ASD of 2-3 minutes is considered good. Session durations of 3-5 minutes are typical for e-commerce platforms, while 5+ minutes are expected for social media platforms.
3. User retention rate (URR)
This metric measures the percentage of users who return to your product or service after their initial experience. It’s fundamental for assessing customer loyalty and long-term engagement.
Why is URR important?
A high retention rate indicates that users find value in your offering, leading to ongoing engagement and reduced churn. Retention is often more cost-effective than acquisition, making URR a crucial metric for sustainable growth.
How to calculate URR
Calculate the percentage between the number of returning users and the number of new users.

Example: Suppose your platform gained 500 new users in January, and by the end of February, 200 of those users had returned to use your service. The URR is (200 / 500) x 100% = 40%.
Benchmark
A 30-day retention rate of 20-25% is considered good for mobile apps. For subscription-based services, monthly retention rates above 75-80% are typical. High-performing digital products often aim for retention rates above 90%.
🔙 Churn rate is another critical user engagement metric you should track. You can calculate it by using our dedicated calculator.
Product engagement metrics
Product engagement metrics help you understand how users interact with your product, offering insights into product usage. By measuring how often and how deeply customers engage with your product, these metrics reveal the aspects of your product that are driving user satisfaction — or causing friction.
Such metrics are crucial for optimizing product features, improving user experience (UX), and increasing retention. For example, low engagement may signal the need for better customer onboarding or feature accessibility, while high engagement can indicate opportunities for upselling or expanding usage.
Here are the key product engagement metrics you need to track.
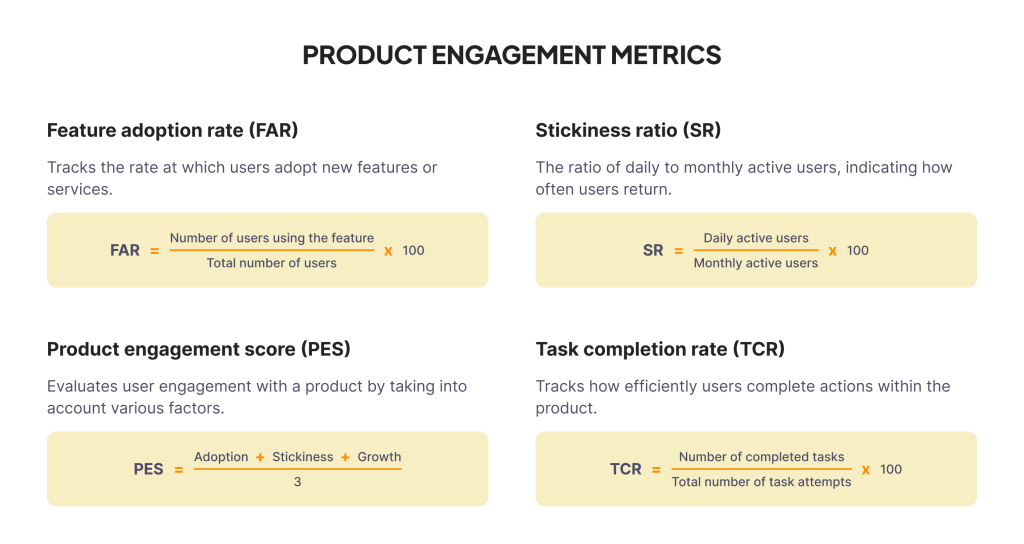
4. Feature adoption rate (FAR)
FAR measures the percentage of users who have started using a newly introduced feature or service within your product. It evaluates how well new product updates are received and adopted by your user base.
Why is FAR important?
FAR helps product teams understand user acceptance of new features, helping them establish the effectiveness of product enhancements. A high adoption rate indicates that the new feature meets user needs and aligns with their behavior patterns. Conversely, a low FAR suggests that the feature may need more visibility or better user education.
Jayanti Katariya, CEO at Moon Invoice, explains this further:
How to calculate FAR
Calculate the percentage between the number of returning users and the number of new users.

Example: Suppose you released a new reporting feature in your product, and over the first month, 500 users engaged with it out of a total of 2,000 active users. The FAR is (500 / 2,000) x 100% = 25%.
Benchmark
Generally, an adoption rate of 20-30% is considered good for new features in SaaS products. For high-impact features that are well-publicized, a benchmark of 40-50% can indicate strong user interest.
5. Stickiness ratio (SR)
SR measures how frequently users return to your product. It indicates the level of habitual usage and product dependence among your users.
Why is SR important?
This metric helps identify the portion of your user base that engages with your product on a regular basis. A high stickiness ratio means users find value in your product and are likely to form a habit of using it. This metric is crucial for understanding product retention and long-term growth.
Derek Bruce, operations director at First Aid at Work Course, elaborates:
How to calculate SR
Calculate the percentage between DAU and the total number of monthly active users (MAU).

Example: If your platform has an average of 500 DAU and 2,000 MAU in a given month, the SR is (500 / 2000) x 100% = 25%.
Benchmark
For social media and communication platforms, a stickiness ratio of 30-50% is typical. For SaaS products, a ratio of 15-25% indicates healthy engagement.
6. Product engagement score (PES)
This composite metric measures user engagement with your product by considering multiple factors, such as FAR, SR, and growth rate (GR). It offers a holistic view of user engagement.
Why is PES important?
PES gives you an at-a-glance view of your product’s health and user engagement levels. By tracking PES over time, product managers can identify highly engaged user segments, address disengagement risks, and prioritize product improvements. It also helps measure the impact of updates and changes on user behavior.
How to calculate PES
To calculate PES, you will need the three key components — FAR, SR, and GR (user growth over a specified period, reflecting an increase or decrease in product adoption). Once you have them, the formula for calculating PES is:

Example: Suppose you’re tracking the PES for your SaaS product over a month. Your metrics for the month are as follows:
- FAR: Out of 2,000 active users, 1,000 users have adopted a new feature, so FAR is 50%.
- SR: You have 500 DAUs and 2,000 MAUs, so the stickiness is (500 / 2,000) x 100% = 25%.
- GR: The user base grew from 1,800 to 2,000 users during the month, so the growth rate is [(2,000 – 1,800) / 1,800] x 100% = 11.1%.
Therefore, PES = (50% + 25% + 11.1%) / 3 = 86.1% / 3 = 28.7%.
Benchmark
PES benchmarks depend on the product’s nature and customer expectations. Establishing an internal benchmark by analyzing historical data and industry norms is ideal. A higher PES indicates greater engagement, while a drop signals potential issues with product experience or relevance.
7. Task completion rate (TCR)
TCR measures the percentage of users who successfully complete a specific action or workflow within your product. It’s commonly used in UX and product management to assess the efficiency and usability of core features.
Why is TCR important?
TCR provides insight into how effectively users can achieve their goals using your product. A high TCR suggests a smooth UX, while a low TCR indicates potential friction points or usability issues that need to be addressed.
How to calculate TCR
Calculate the percentage between the number of completed tasks and the total number of task attempts.
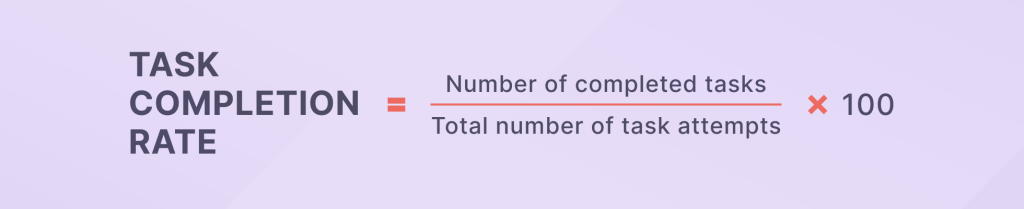
Example: If 300 users attempted to complete a checkout process and 240 successfully finished it, the TCR is (240 / 300) x 100% = 80%.
Benchmark
A good TCR varies depending on the complexity of the task. For simple actions like filling out a form, a TCR of 85-90% is expected. For more complex workflows, such as multi-step onboarding processes, a TCR of 70-80% is considered healthy.
Website engagement metrics
Website engagement metrics evaluate how users interact with your site, offering insights into their behavior and experience. These metrics are particularly important for industries like e-commerce, SaaS, and tech, where the website often serves as a primary point of interaction with customers.
Tracking these metrics can help you improve UX and optimize your website for conversions.
Here are the key website engagement metrics you should monitor closely.
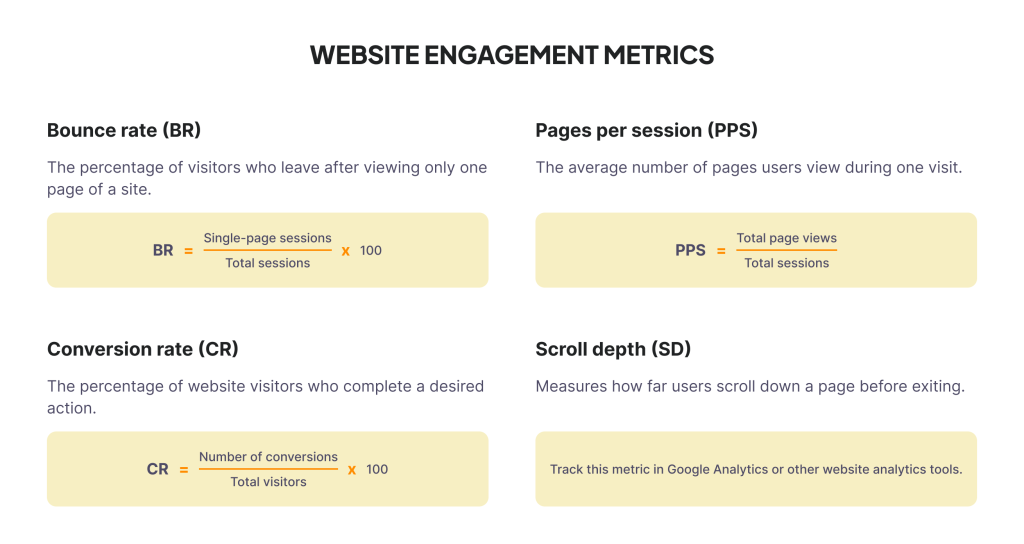
8. Bounce rate (BR)
This metric represents the percentage of visitors who leave your website after viewing only one page. A high bounce rate often indicates that users didn’t find what they were looking for or that your landing page didn’t spark their curiosity.
Why is BR important?
A high bounce rate can signal issues with UX, content relevance, or page load speed. Monitoring it is essential to understanding whether your landing pages are effective at engaging visitors and guiding them through your site.
How to calculate BR
Calculate the percentage between the number of single-page sessions and the total number of sessions on your website.

Example: If your website has 1,000 sessions in a month and 400 of those sessions result in a bounce (single-page session), your BR is (400 / 1,000) x 100% = 40%.
Benchmark
An average bounce rate typically falls between 41% and 55%. Anything below 40% is considered excellent, while a rate above 70% indicates potential engagement issues.
9. Pages per session (PPS)
PPS measures the average number of pages users view during a single visit. It shows how deeply users are engaging with your content and exploring your site.
Why is PPS important?
A higher number of pages per session suggests that users find your content valuable and are interested in exploring multiple pages. This metric helps establish content relevance, site structure effectiveness, and the potential for lead conversion.
How to calculate PPS
Divide the total number of page views by the total number of user sessions on your website.

Example: Let’s say your website received 5,000 page views and had 1,000 sessions in a month. Your PPS is 5,000 / 1,000 = 5.
Benchmark
The average benchmark for PPS is around 2-3. Higher values are common for content-rich or e-commerce websites, while lower values might indicate less engagement or interest.
🎯 Another relevant website engagement metric is the conversion rate. Feel free to use our free tool to calculate it.
10. Scroll depth (SD)
SD measures how far users scroll down a page before exiting or leaving. It helps determine which sections of your page are most engaging and which content users miss out on.
Why is SD important?
SD provides insight into whether users are consuming your entire content or dropping off at specific points. This can highlight potential design issues, misplaced calls to action, or unengaging content.
How to calculate SD
This metric can be tracked using Google Analytics (GA) by setting up custom scroll-tracking events that measure scroll percentages (e.g., 25%, 50%, 75%, 100%). You can also use website analytics tools like Hotjar to track it.
Example: If 50% of users scroll down to the bottom of your page, while 30% leave after scrolling only 25% of the way, it might indicate that your initial content needs to be more engaging.
Benchmark
There’s no universal benchmark for SD, as it largely depends on content length and purpose. However, achieving 50% or higher scroll completion is generally considered effective for most content pages.
Community engagement metrics
Community engagement metrics measure how actively your audience interacts with your brand’s community spaces, whether online or offline. These metrics track the level of participation, enthusiasm, and loyalty of your customers, giving you insights into how well your community-building efforts are resonating.
Strong community engagement can lead to increased customer advocacy, retention, and even valuable user-generated content (UGC).
Here are the essential community engagement metrics you should be tracking.
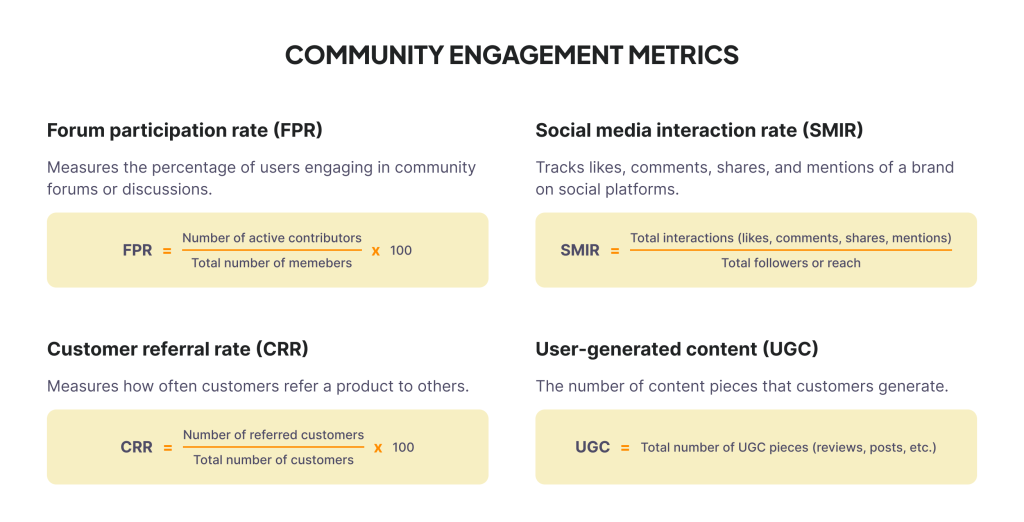
11. Forum participation rate (FPR)
FPR helps community managers understand how many members are actively contributing by posting, commenting, or interacting with others compared to the total number of registered members.
Why is FPR important?
FPR provides insights into your community’s health and vitality. A high FPR indicates that members are engaged, find value in participating, and are more likely to remain active over time. A low FPR, however, may suggest that your forum content is not resonating with the audience or that the community is more of a passive group.
How to calculate FPR
Calculate the percentage between the number of active contributors (NAU) and the total number of members (TNM) on your forum.

Example: Let’s assume you have an online forum with 150 NAU and 2,000 TNM for a month. The FPR is (150 / 2,000) x 100% = 7.5%.
Benchmark
Forum participation rate benchmarks typically range from 10-30%, with highly engaged communities reaching 40-50% or more. Newer or niche forums often see lower rates, around 5-10%.
12. Social media interaction rate (SMIR)
SMIR measures the engagement your brand receives on social platforms, including likes, comments, shares, and mentions. This metric captures how often users interact with your content and indicates the level of interest and involvement of your audience. When it comes to engagement metrics, social media is becoming increasingly relevant.
Why is SMIR important?
SMIR helps assess the effectiveness of your social media strategy and content in engaging your community. High interaction rates suggest strong resonance with your audience, while low rates may indicate that your content isn’t capturing their attention or providing value.
How to calculate SMIR
Divide the total number of social interactions by the total number of people following your pages.

Example: If one of your posts receives 500 interactions (likes, comments, shares) and your total reach for that post is 10,000, your SMIR is (500 / 10,000) x 100% = 5%.
Benchmark
Social media interaction rates vary by platform and industry, but a good benchmark is around 1-3% for larger audiences and 5-10% for smaller, more engaged communities.
13. Customer referral rate (CRR)
CRR measures the percentage of existing customers who refer your product or service to others. It reflects customer satisfaction and loyalty, as well as their willingness to advocate for your brand.
Why is CRR important?
A high CRR indicates strong engagement, suggesting that customers are willing to promote your brand to their networks. This can lead to organic growth and cost-effective customer acquisition through word-of-mouth marketing.
Shawn Plummer, CEO of The Annuity Expert, highlights the importance of tracking CRR:
How to calculate CRR
Calculate the percentage between the number of referred customers and your total number of customers.
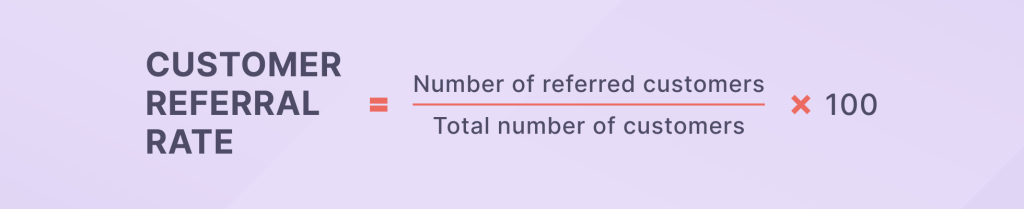
Example: If you have 1,000 total customers and 200 of them were referred by existing customers, your CRR is (200 / 1,000) x 100% = 20%.
Benchmark
A good benchmark for CRR is around 10%-30%, depending on the industry and type of product. Higher referral rates are typically seen in industries with strong brand loyalty or where the product/service is highly differentiated.
14. User-generated content (UGC)
This metric measures the number of content pieces, such as reviews, social posts, and photos, that customers create and share about your brand. UGC is a strong indicator of community engagement and brand advocacy.
Why is UGC important?
UGC reflects the authenticity of your brand’s relationship with its community. It shows that customers are actively engaged and motivated to share their experiences with others. This type of content often serves as social proof, building credibility and trust for your brand.
How to calculate UGC
Sum up all your UGC pieces.

Benchmark
There’s no universal benchmark for UGC, as it largely depends on the size and activity level of your community. However, tracking monthly growth and striving for steady increases in UGC contributions indicates a healthy and engaged community.
How to measure customer engagement properly
As previously mentioned, today’s customers engage with companies through multiple channels. Each platform caters to different aspects of the customer journey, so a holistic approach to tracking engagement is needed. Without it, you risk missing out on crucial insights that could shape your strategy.
Here is how to implement this approach.
Customer surveys
Surveys provide context and deeper insights into customer motivations, preferences, and overall experience with a given product.
A good way to start is by sending customer effort score surveys. They measure how difficult it is for customers to achieve a task or resolve an issue. This can reveal issues that customers face when using your product or service that may not be apparent through behavioral metrics alone.
Qualitative feedback
Qualitative customer feedback can complement quantitative metrics, helping you understand the “why” behind engagement patterns.
Gather qualitative feedback through surveys, reviews, and direct conversations. Ask for reviews after specific actions, such as a completed purchase or the resolution of a support issue. For example, after a customer completes an order, send an email saying, “We’d love to hear your thoughts on your recent purchase!”
Segmentation
Segment your customers based on behavior, demographics, and preferences. This allows you to track engagement within specific groups and tailor strategies to different customer segments, resulting in more targeted and impactful engagement efforts.
You can start with a few broad segments and refine them over time. Basic segments like “New customers” vs. “Returning customers” can later turn into more nuanced segments like “Customers who purchase during sales events.”
Analytics tools
These tools allow you to track various engagement metrics across multiple channels and identify trends and patterns to help you optimize your engagement strategy.
- Apart from measuring SD, GA sheds light on metrics like BR, PPS, ASD, and CR.
- Product analytics platforms like Mixpanel or Amplitude track events and analyze user flows, retention, and conversion rates within your product.
- Social listening tools measure sentiment, track brand mentions, and identify trending topics within your community.
Benchmarking
Use historical data or industry standards to set benchmarks for engagement metrics such as ASD, click-through rates, or retention.
You can use data from GA, customer relationship management systems, or even email marketing platforms. Regularly monitor these benchmarks to evaluate your progress and identify areas for improvement. Compare against competitors using tools like SimilarWeb, Ahrefs, or Semrush.
Continuous iteration
Analyze engagement data periodically and adjust your strategies based on what’s working and what’s not. Regular iteration helps you refine your approach and develop a deeper understanding of what drives engagement for your target audience.
Track the right customer engagement metrics
Customer engagement metrics help you gain a deep understanding of what customers value. What drives their engagement? Are there any potential friction points? Metrics contain all that information and more.
To profit from gathering and analyzing these indicators, set clear goals for each metric, consistently monitor performance, and leverage the insights gained to optimize customer touchpoints.
Boosting long-term profitability relies on a proactive approach to staying ahead of the competition, so start building yours today!
Related articles

SMS marketing for restaurants: Key benefits & best practices
SMS marketing, particularly vital in the time-sensit...
How to use ChatGPT for SMS marketing success
SMS marketing is a powerful marketing strategy that ...

Communication breakdown: What it is and how to avoid it
Discover practical strategies to prevent and swiftly...

Top strategies for growing your mobile opt-in list in 2024
Mobile opt-in lists help businesses reach their audi...

Workplace collaboration: Our secrets to more productive teams
Seamless collaboration in the workplace is a game-ch...